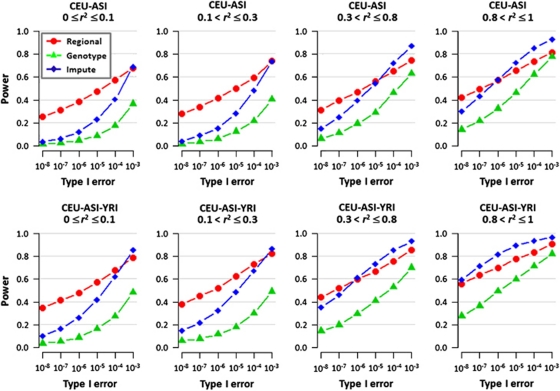
Figure 3.
Power comparisons of the different methods for meta-analysis in the presence of allelic heterogeneity. A different causal variant was selected in CEU and JPT+CHB, respectively, while either of the two causal variants was equally likely to be present in the YRI simulations. The two causal variants are located at least 20 kb away but are not >50 kb apart, and have minor allele frequencies of at least 10% in all three HapMap populations. The case–control genotype data simulated from HAPGEN were subsequently thinned to the SNP content of Affymetrix 500K (CEU), Illumina 1M (JPT+CHB) and Affymetrix 6.0 (YRI). We calculated the power when only the CEU and JPT+CHB populations were combined (top row), and when all three HapMap panels were combined (bottom row), investigating the performance of the meta-analysis across the SNPs on all three arrays (green triangles), and for the region-based meta-analysis considering 250 kb regions (red circles). Imputation was performed with population-specific haplotypes to recover the SNPs removed from the thinning, and a SNP-based meta-analysis was performed on this denser set of imputed and genotyped SNPs common to all three populations (blue diamonds). We binned the 3000 pairs of causal variants according to the LD between the two SNPs into four groups: (i) 0≤r2≤0.1; (ii) 0.1 <r2≤0.3; (iii) 0.3 <r2≤0.8; (iv) 0.8 <r2≤1.

