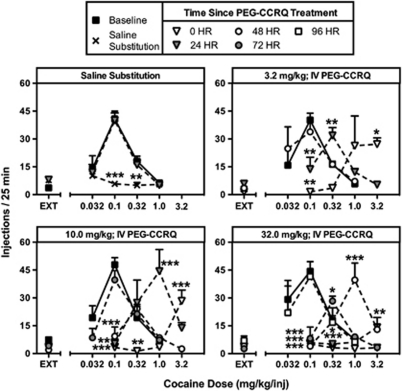
Figure 2.
Time course of the effects of PEG-CCRQ CocE on FR5TO5 responding maintained by cocaine (0–3.2 mg/kg; IV) during five sequential 25 min components. Responding for cocaine (filled squares; 0.0–1.0 mg/kg/inj) during sessions immediately preceding treatment were used for baseline. Upper left panel: Responding during the substitution of saline for cocaine (X), and upon reintroduction of cocaine 24 h later (shaded triangles). Data represent the mean±the standard error of the mean (SEM) number of cocaine injections (n=6) earned during each 25 min component immediately after (open triangles), 24 h after (shaded triangles), 48 h after (open circles), 72 h after (shaded circles), and 96 h after (open squares) the administration of 3.2 mg/kg; IV (upper right panel), 10.0 mg/kg; IV (lower left panel), or 32.0 mg/kg; IV PEG-CCRQ CocE (lower right panel). Points above extinction (EXT) refer to the number of completed ratios that resulted in presentation of stimuli associated with injections, but no injection. *p<0.05; **p<0.01; and ***p<0.001 represent points that were significantly different than baseline (0.0–1.0 or 0.0–3.2 mg/kg/inj cocaine) as determined by two-way, repeated measures ANOVA with post hoc Bonferroni tests.

