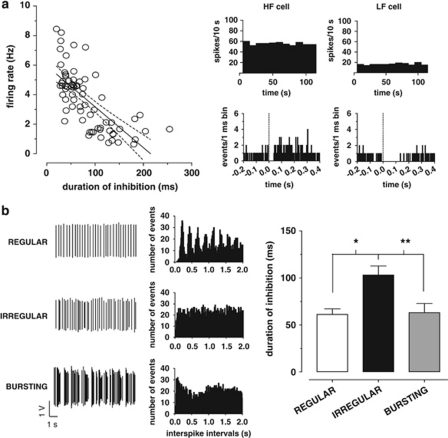
Figure 2.
The duration of RMTg-evoked inhibition is negatively correlated with the spontaneous discharge activity of VTA DA neurons. (a) On the left, the graph illustrates the negative correlation between spontaneous firing rate and duration of inhibition induced by RMTg stimulation (dashed lines represent ±95% confidence intervals). Representative rate histograms (top right) and PSTHs (bottom right) of two individual DA cells displaying that a high firing neuron (HF cell) was suppressed for a shorter period of time than a low firing neuron (LF cell). (b) Autocorrelograms of DA neurons were generated from action potential recordings and allowed the classification of their firing pattern into regular (top), irregular (middle), and bursting (bottom) mode. The right bar graph shows that irregular neurons exhibited a longer inhibitory response to RMTg stimulation when compared with regular or bursting cells. *P<0.05, **P<0.01, one-way ANOVA, and Tukey's test.

