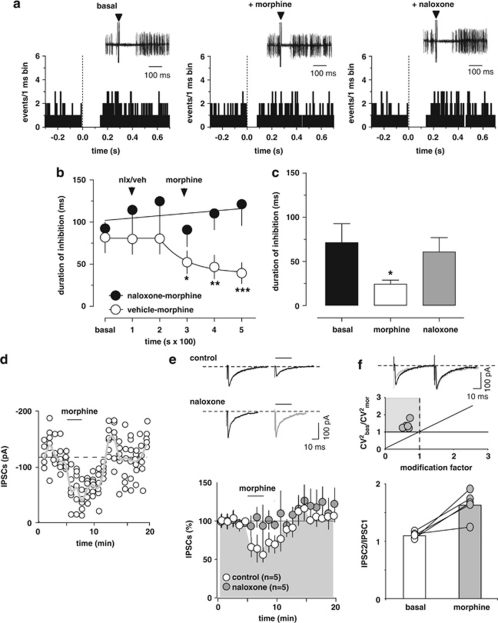
Figure 5.
Morphine shortens the duration of RMTg-evoked inhibition of VTA DA neurons through activation of μ-opioid receptors. (a) Representative PSTHs and superimposed traces acquired from a digital oscilloscope (insets) showing inhibitory responses elicited in DA neurons by RMTg stimulation (1 Hz, delivered at time 0, arrowheads). Morphine (4 mg/kg, iv) reduced RMTg-evoked inhibition. The effect was fully reverted by the μ-opioid antagonist naloxone (0.1 mg/kg, iv). (b) Time course of morphine's effects on RMTg-evoked suppression of VTA DA discharge activity, with and without (n=7) naloxone pretreatment. Naloxone (nlx) completely prevented morphine's reduction of inhibition (n=6). (c) The bar graph summarizes the actions of morphine on the duration of VTA inhibition induced by RMTg stimulation and shows that naloxone (n=5, 5 min after morphine) reverts morphine's effects. (d) Morphine induces inhibition of GABA synaptic transmission elicited by stimulation of RMTg afferents in rat VTA DA cells. A typical whole-cell patch clamp recording showing that bath application of morphine (1 μM) inhibits IPSC amplitude, when cells are held at −70 mV. The gray line represents mean IPSC amplitude. (e) Morphine reduces IPSC amplitude through activation of μ-opioid receptors. All data are normalized to the respective baseline (5 min of baseline). The black bar shows time of superfusion of morphine in the presence (gray circles) and absence (open circles) of the μ-opioid antagonist naloxone (100 nM). SEM bars are smaller than symbols in some cases. The inset shows 12-trace averages of IPSCs in the absence (black line) and presence (gray line) of naloxone. Black bars represent time of morphine application. (f) Top panel, from the data presented in e, the ratio of CV2 in morphine to baseline is plotted against the modification factor (ie, the ratio of mean synaptic responses in morphine to baseline values). Data points in the gray area and along the diagonal line of y=x imply a presynaptic reduction of synaptic transmission induced by morphine. Bottom panel, morphine enhances the paired-pulse ratio of IPSCs, producing paired-pulse facilitation. The circles show the paired-pulse ratio for each of the experiments in f before (open circles) and during (gray circles) the application of morphine, whereas the graph plots the averaged paired-pulse ratio in a bar graph form. Representative traces are shown in the inset, where the IPSCs are represented before (black lines) and during morphine (grey lines) application. The results are means with vertical bars representing the SEM of the duration of inhibition expressed as a percentage of the baseline. Arrows represent the time of injections. *P<0.05, ** P<0.001, ***P<0.0001 vs baseline, and one-way ANOVA.

