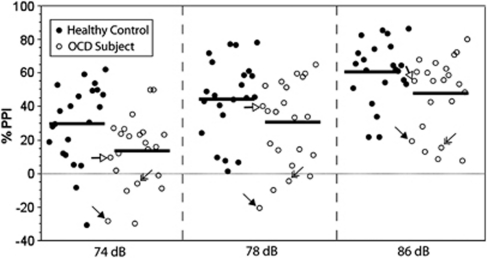
Figure 2.
Percent PPI for each individual subject demonstrates inter-subject variation. Scatter-plot indicates percent PPI for each individual subject at PP intensities of 74, 78, and 86 dB. Closed circles indicate healthy controls (n=22) and open circles indicate OCD subjects (n=22). Black bars indicate the mean percent PPI at each PP intensity. The three individuals with tics are highlighted with arrows; each individual subject is assigned a different arrowhead (filled, open, or double) that can be tracked across all three PP intensities.

