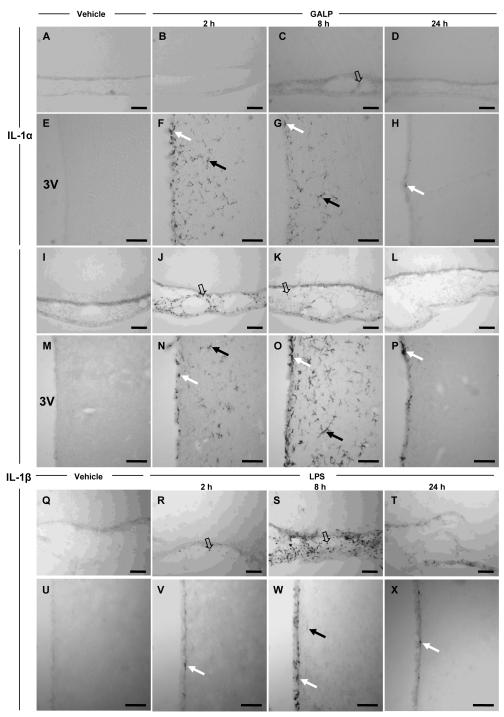
FIG. 1.
Effect of galanin-like peptide (GALP) or lipopolysaccharide (LPS) on IL-1α and IL-1β expression in the rat brain. The pictures are representative photomicrographs of IL-1α- (A-H) and IL-1β- (I-P) expressing cells after intracerebroventricular (icv) injection of either 1 μl saline (n = 3, A, E, I and M at 8 h) or 1.5 nmol GALP (in 1 μl, n = 3, B-D, F-H, J-L and N-P). Expression of IL-1α and IL-1β was observed at 2 and 8 h in the ependymal cells of the ventricles and the parenchyma surrounding the ventricles, e.g. the peri-third ventricular hypothalamic region (F-H and N-P), following GALP injection. Expression of IL-1β was also seen at 2 and 8 h in the meninges (J-K). Expression of IL-1α and IL-1β at 24 h was observed only in a few ependymal cells of the ventricles (H and P). IL-1α- and IL-1β- positive cells were also observed at 4 h but as expression was virtually identical to that observed at 2 h, data are not shown. Photomicrographs for vehicle-treated animals are only shown for 8 h, but no IL-1α- or IL-1β-expressing cells were observed at any of the time points studied (2, 4, 8, and 24 h). The morphology of IL-1α- and IL-1β-expressing cells appears to be microglia in parenchyma (solid arrows) and ependyma (white arrows), and macrophages (open arrows) in the meninges. For each time point, the pictures represent IL-1α or IL-1β expression in sections taken from the same animal. Q-X represent the effect of icv injection of 100 ng LPS or vehicle on IL-1β expression in the meninges (Q-T) and the peri-third ventricular hypothalamic region at 2 (R and V), 8 (S and W) and 24 h (T and X). Scale bars, 100μm

