Figure 2.

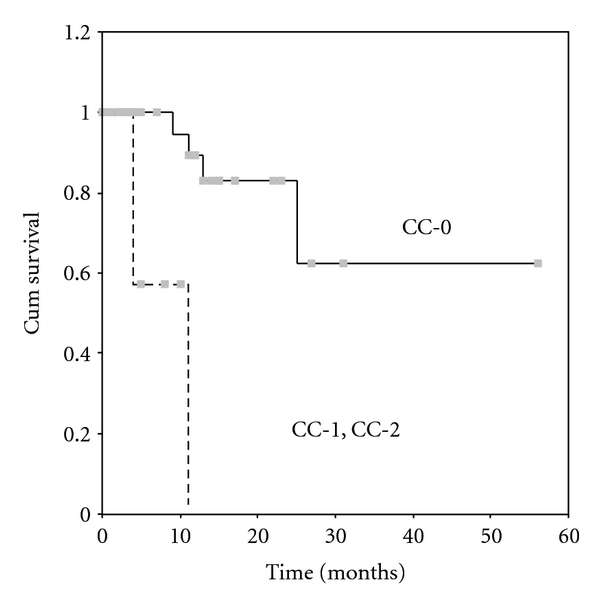
Survival according to CC score. The continuous line is for patients with CC-O and the dotted line is for patients with CC-1, CC-2 (P = 0.0001).

Survival according to CC score. The continuous line is for patients with CC-O and the dotted line is for patients with CC-1, CC-2 (P = 0.0001).