
Figure 1.
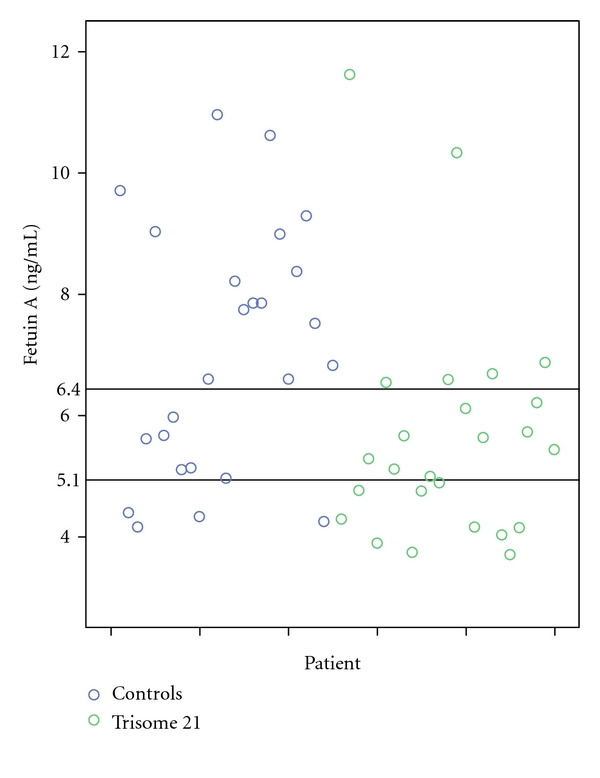
Scatter-plot graph of fetuin A concentrations (ng/mL) in normal fetuses and fetuses with trisomy 21.
Official websites use .gov
A
.gov website belongs to an official
government organization in the United States.
Secure .gov websites use HTTPS
A lock (
) or https:// means you've safely
connected to the .gov website. Share sensitive
information only on official, secure websites.
Scatter-plot graph of fetuin A concentrations (ng/mL) in normal fetuses and fetuses with trisomy 21.