
Figure 5.
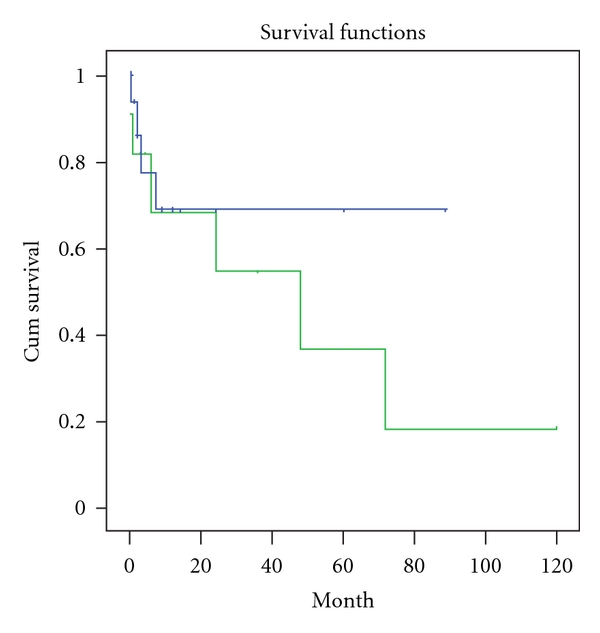
IgAN patients who had higher TID scores at baseline had worse renal outcome in follow-up period (Log rank P = 0.005). In this figure, green line represents those patients with higher TID scores.
Official websites use .gov
A
.gov website belongs to an official
government organization in the United States.
Secure .gov websites use HTTPS
A lock (
) or https:// means you've safely
connected to the .gov website. Share sensitive
information only on official, secure websites.
IgAN patients who had higher TID scores at baseline had worse renal outcome in follow-up period (Log rank P = 0.005). In this figure, green line represents those patients with higher TID scores.