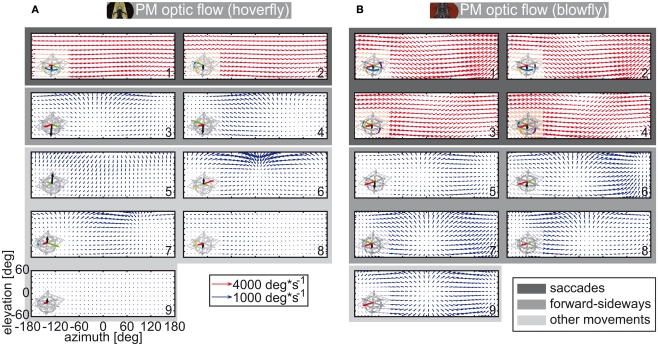
Figure 3.
Mean optic flow induced by prototypical movements. Optic flow calculated geometrical from head trajectories of both species. The red arrows are scaled differently than the blue ones (they code for four times the velocity of the blue arrows). A field of view of 120° elevation is depicted. The mean optic flow for each prototypical movement was calculated (numeration as in Figure 1). In the lower left corner of each flow field the corresponding PM is shown. (A) Eristalis optic flow calculated with head trajectories and segregated after body PMs. (B) Calliphora optic flow calculated from head trajectories and segregated after head PMs.

