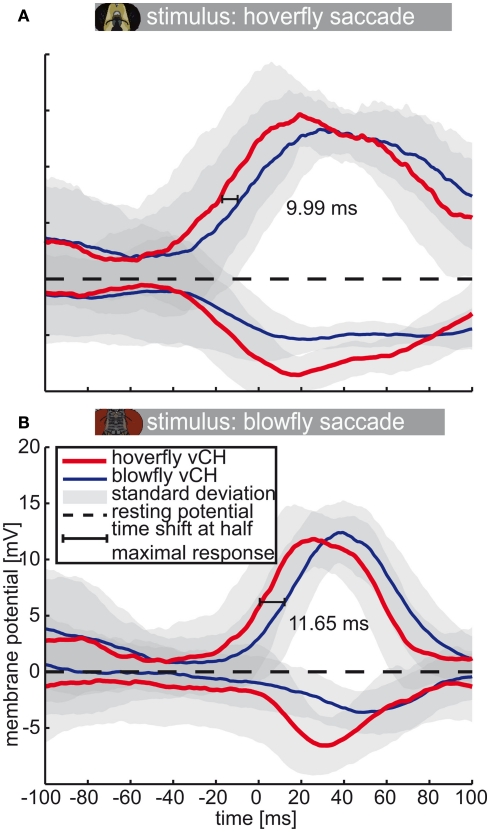
Figure 7.
Saccade-triggered vCH response. Mean response (±SD) of Eristalis and Calliphora vCH cells, respectively, in a 200-ms time window centered about the peak velocity of yaw saccades (0 ms). Eristalis response (N = 8, n = 3–11) is plotted in red and the Calliphora response (N = 5, n = 3–23) is plotted in blue. Light green numbers and line denote the time shift between mean responses at half-maximal response. Resting potential is marked by the dashed black line. (A) Eristalis, (B) Calliphora saccades.

