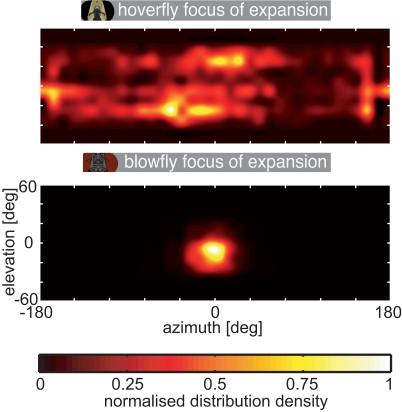
Figure A1.
Distribution of the focus of expansion. The location of the focus of expansion within the visual field was calculated from the optic flow corresponding to the head trajectories and plotted as color coded density distribution; top: hoverfly, bottom: blowfly. The data were interpolated to avoid hard edges of the sample point grid (grid as in Figure 3). The density was normalized to the highest count inside the sample point grid separately for each plot.

