
Fig. 1.
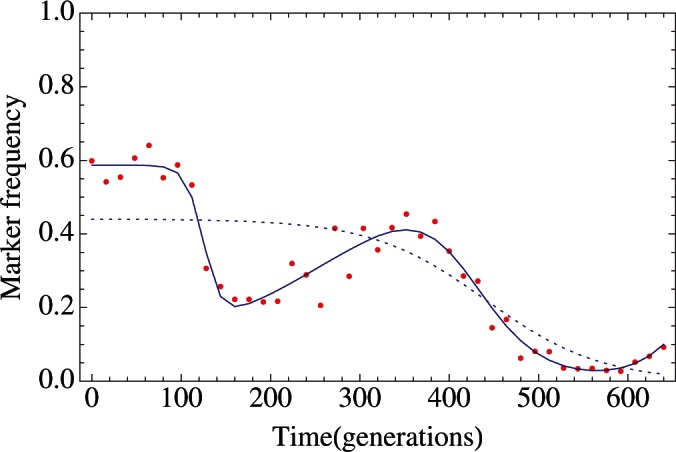
Complex marker trajectories are better explained with multiple mutations. Inferred frequencies for an example population [data from (Barrick et al., 2010)] are shown from models with one (blue dotted line), and four (blue solid line) beneficial mutations. The observed frequencies are shown as red dots. AIC scores for the two models were 364.8 and 156.4, respectively. Optimal two-, three- and five-mutant models had AIC scores of 313.8, 208.6, and 163.5, respectively.