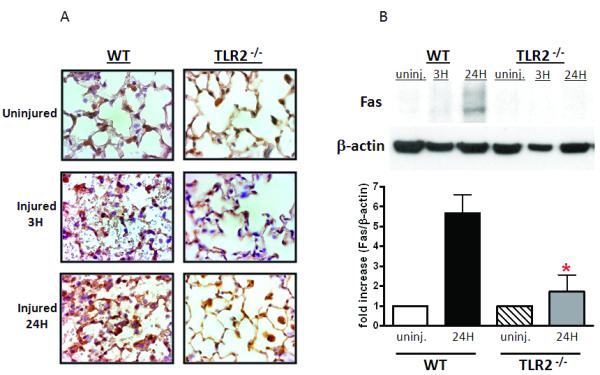
Figure 7. TLR2 specific injury response: Fas expression.

Immunohistochemistry (A) and immunoblot analysis (B) was used to visualize Fas expression in uninjured or injured lungs at 3H or 24H after contusion as described in the methods. WT and TLR2−/− sections are shown at 100X and are representative of at least 3 independent observations. Immunoblot of WT and TLR2−/−lung lysates are shown (B, top) and Fas protein levels quantitated and normalized to β-actin (B, bottom, n=3). Significant differences (*p<0.05) are indicated.
