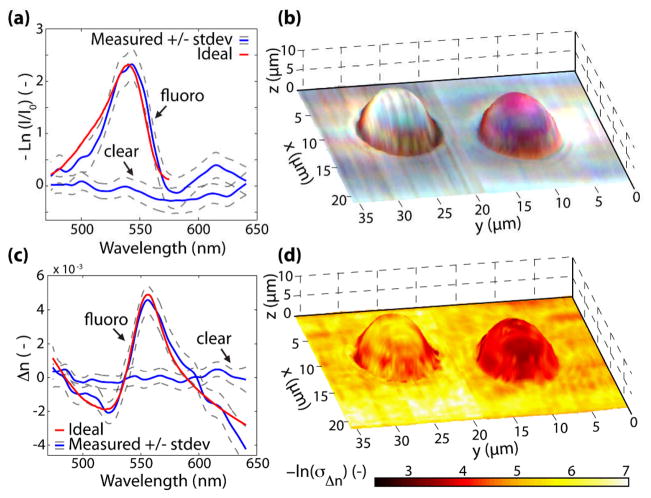
Fig. 2.
(Color online) (a) Negative log of the normalized spectrum from the center of each bead. (b) True color representation of the sample superposed on the topological map. (c) Changes in the refractive index for a point at the center of each bead. (d) Negative log of the standard deviation of the changes in the real part of the RI superposed with the topological map.

