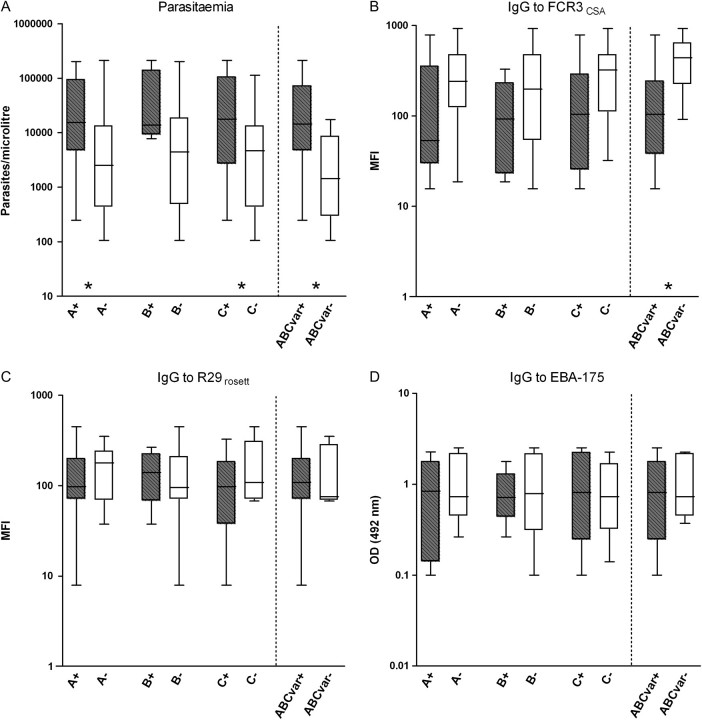
Figure 2.
Parasitemia and immunoglobulin G (IgG) levels against Plasmodium falciparum antigens in pregnant women infected in their placentas with isolates transcribing A, B, or C var gene groups (plus signs, gray boxes) and isolates not transcribing that particular var subgroup (minus signs, white boxes). Placental isolates transcribing at least 1 of the A, B, or C var groups (ABCvar+) were compared with isolates exclusively transcribing var2csa (ABCvar−). Data are shown as log-transformed number of parasites per microliter, mean fluorescence intensity (MFI), or optical density (OD) values, respectively. Boxes delimit medians and interquartile ranges; bars indicate extreme values. *P < .05, Kruskal-Wallis test.

