
. 2012 Jan;135(1):72–77. doi: 10.4103/0971-5916.93427
Copyright: © The Indian Journal of Medical Research
This is an open-access article distributed under the terms of the Creative Commons Attribution-Noncommercial-Share Alike 3.0 Unported, which permits unrestricted use, distribution, and reproduction in any medium, provided the original work is properly cited.
Fig. 1.
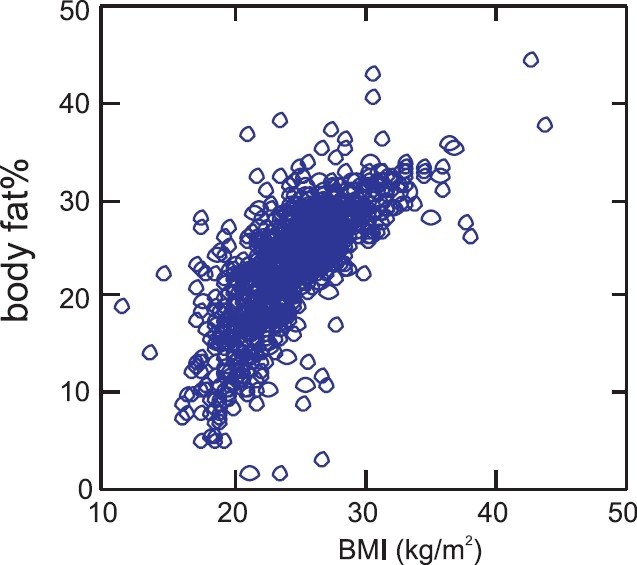
Scatter plot between BMI and body fat per cent.