
Figure 1.
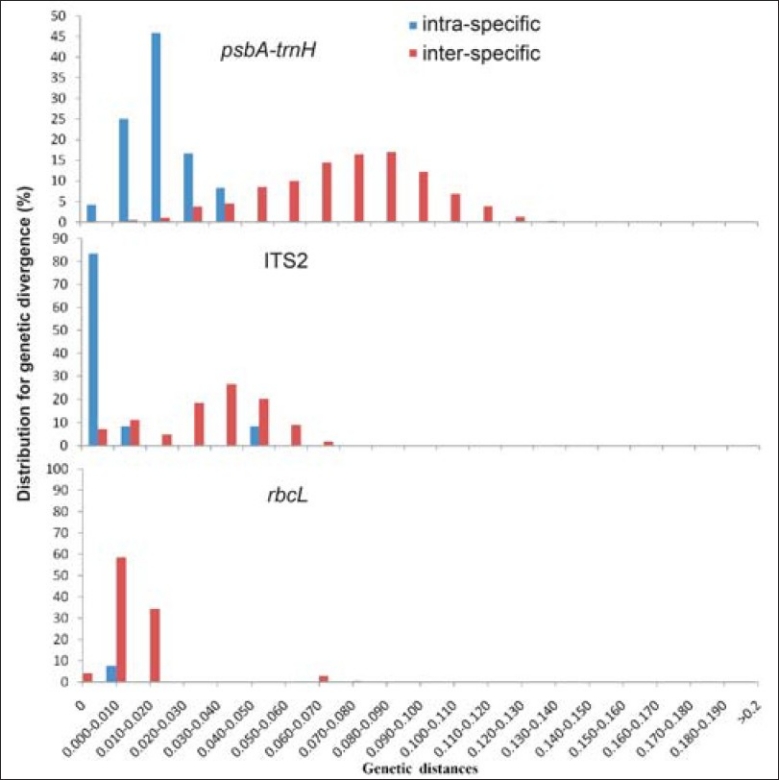
The barcoding gap between interspecific and intraspecific divergences for three candidate barcodes. Histograms showing the relative distribution of pairwise (y-axes) intraspecific (blue bar) and interspecific (red bar) divergence distance estimates (x-axes) for psbAtrnH, ITS2, and rbcL intergenic spacers, respectively. The divergences were calculated using the Kimura 2-Parameter (K2P) model. Barcoding gaps were assessed by the Wilcoxon two-sample tests, and all were highly significant (P < 0.0001)