
Figure 2.
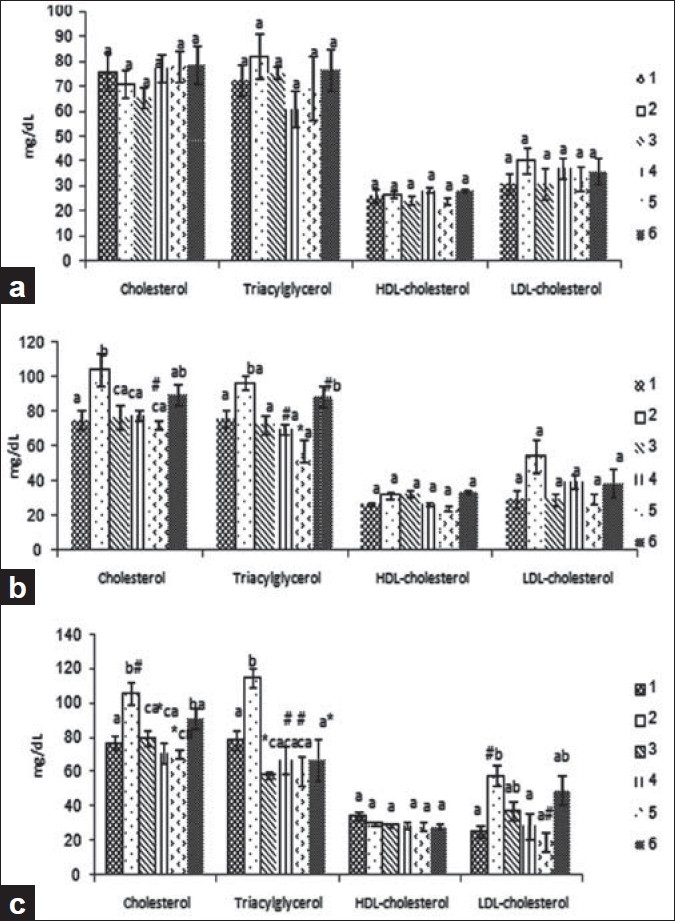
Blood serum cholesterol, triglycerides, HDL- and LDLcholesterol concentration (mg/dl) of male diabetic rats fed variant diet of the 7, 14 and 28 (a, b and c, respectively) days feeding periods. Values are given as mean ± SEM in nine rats in each group. (a–c) Different letters indicate statistically different results. 1 = normal, 2 = diabetic + 0% guar gum, 3 = diabetic + 5% guar gum, 4 = diabetic + 10% guar gum, 5 = diabetic + 20% guar gum, 6 = diabetic + glibenclamide. (# = P < 0.01, * = P < 0.001)