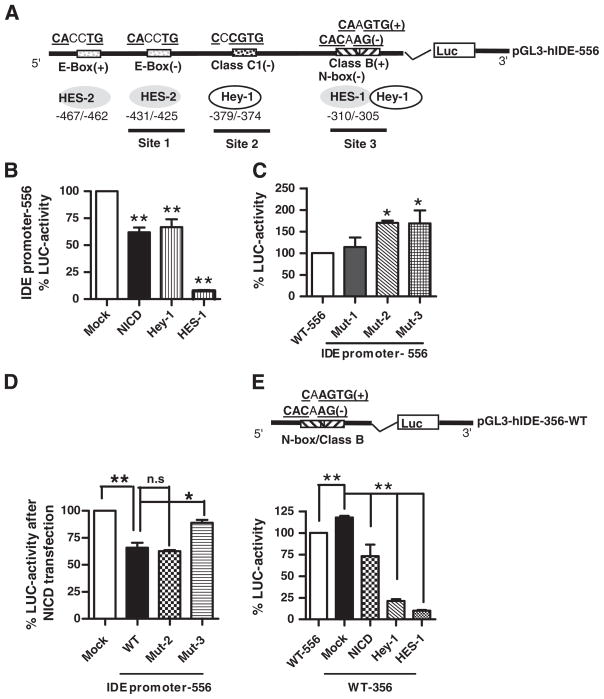
Fig. 4.
Effect of Notch activation on IDE promoter. (A) Schematic representation of the 556 bp fragment (−575/−19) corresponding to the IDE proximal promoter showing the location of E-box (site 1), Class C1 (site 2) and the overlapping Class B/N-box (site 3) sites and their putative consensus sequences for HES and Hey-1 binding. (+), foward orientation; (−) reverse orientation. (B) Bars show the mean±SEM of percentage of Luciferase (LUC) activity determined in N2aSW cells co-transfected with the IDE promoter-556 pb and Mock, NICD, Hey-1 and HES-1 constructs, respectively. **p<0.01 compared to mock-transfected N2aSW cells. (C) Bars show the mean±SEM of percentage of Luciferase (LUC) activity determined in N2aSW cells transfected with IDE promoter-556 wild type (WT) or mutated in site 1 (Mut1), site 2 (Mut2) or site 3 (Mut3), respectively. *p<0.05 compared to WT. (D) Bars show the mean±SEM of percentage of Luciferase (LUC) activity determined in N2aSW cells co-transfected with IDE promoter-556 wild type (WT) or mutated in site 2 (Mut2) or site 3 (Mut3), respectively, and NICD construct. n.s; not significant differences between WT and Mut-2 promoters and *p<0.05 significant differences between WT and Mut-3 promoter. (E) Upper panel, schematic representation of the wild type 356 bp fragment (−337/−19) corresponding to the IDE proximal promoter containing only the overlapping Class B/N-box consensus sequence site (site 3); (+), normal orientation; (−) reverse orientation. Lower panel, bars show the mean±SEM of percentage of Luciferase (LUC) activity determined in N2aSW cells transfected with IDE promoter-556 pb wild type (WT-556) or co-transfected with IDE promoter-356 and Mock, NICD, Hey-1 and HES-1 constructs, respectively. **p<0.01 compared to IDE promoter-556 or to mock-transfected N2aSW cells.

