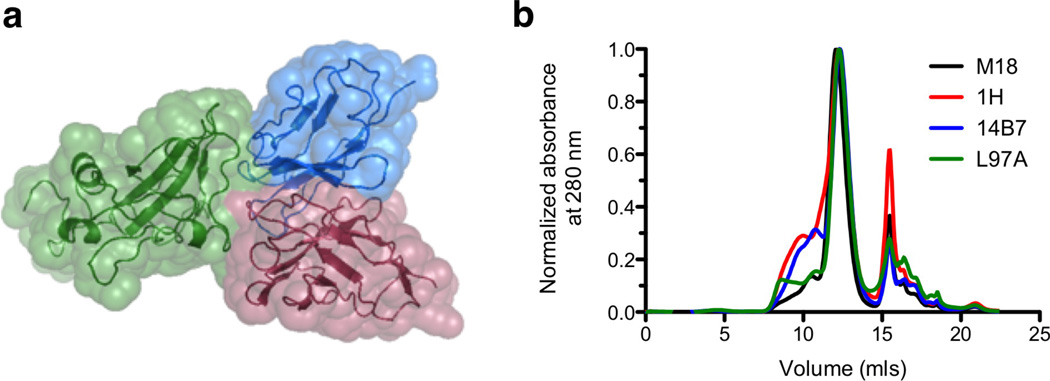
Figure 4.
Characterization of scFv proteins. (a) Structure of the scFv-PA interaction, with domain four of PA shown in green, in complex with the M18 variable light chain in blue and the heavy chain in red. The alpha carbon backbone is shown as a ribbon diagram, with the solvent-accessible surface area indicated by a space-filling model. (From PDB 3ETB; figure prepared with PyMol, www.pymol.org) (b) Traces corresponding to the final scFv purification step, size exclusion chromatography with a GE Healthcare ÅKTA FPLC and Superdex S75 column. The scFv elution peak has an elution volume of 12 mls, corresponding to the expected size of an scFv monomer (25 kDa). The free nickel peak, residual from the metal affinity chromatography step, elutes at 16 mls.

