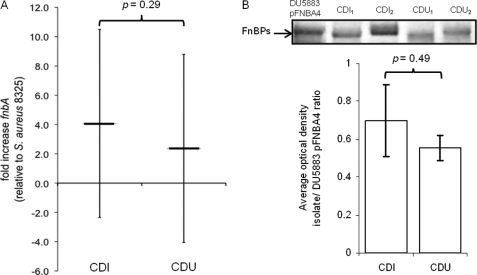
FIGURE 2.
A, quantitative real-time PCR of fnbA expression in S. aureus isolates from the CDI (n = 26) and CDU (n = 20) groups. Error bars indicate average (± 1 S.D.) -fold difference in fnbA expression level for each group relative to reference strain 8325-4. B, Western blot showing protein bands for FnBPs (top) from representative isolates of S. aureus from the CDI and CDU groups. Quantitative densitometry (bottom) of FnBP expression in CDI (n = 10) and CDU (n = 10) isolates normalized to FnBPA produced by S. aureus DU5883 pFNBA4, a strain that overexpresses fnbA.

