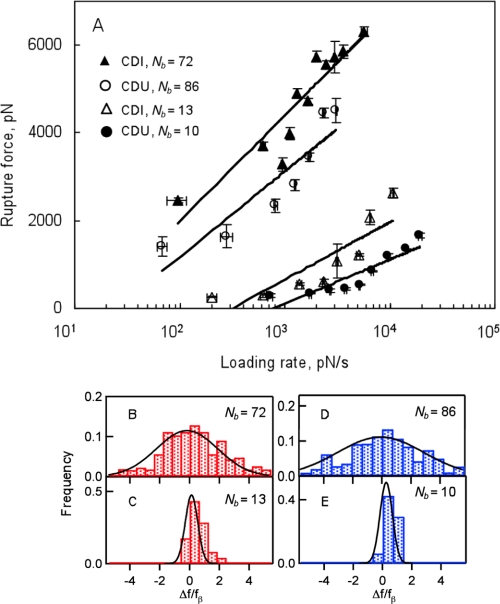
FIGURE 4.
A, dynamic force spectra for the rupture of multivalent Fn–FnBP bonds for S. aureus from the CDI (triangles; n = 26 different isolates) and CDU (circles; n = 20 different isolates) groups. Error bars represent S.D. of the data. Loading rates for the multibond rupture events were normalized by the number of bonds (Nb) according to Refs. 16 and 17. Most probable rupture forces were determined as shown in supplemental Fig. S3. B–E, histograms of normalized residuals from A for different number of bonds according to Ref. 15. CDI are in red for Nb = 72 (B) and Nb = 13 (C); CDU are in blue for Nb = 86 (D) and Nb = 10 (E). The residuals were normalized by the corresponding value of the force scale fβ. Solid lines are Gaussian fits.

