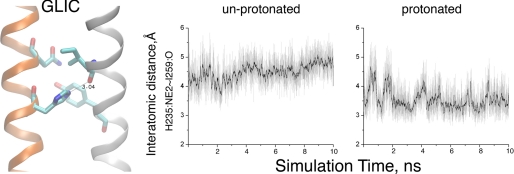
FIGURE 4.
MD simulations of GLIC with His-235 unprotonated and protonated. The left panel shows the hydrogen bond between Nϵ of His-235 and the main chain oxygen atom of Ile-259. The right panels show the interatomic distance versus simulation time for each condition. Black traces indicate the interatomic distances averaged over 40 ps, whereas the light traces show distances measured every 2 ps.

