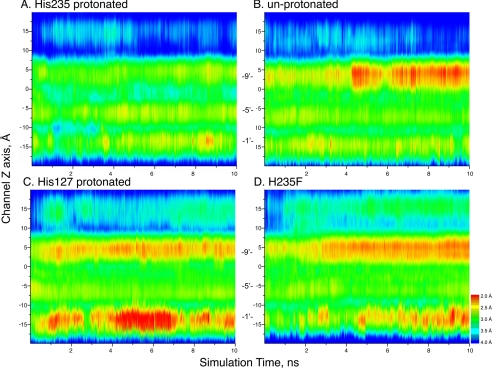
FIGURE 5.
Pore radius versus simulation time for the indicated GLIC structures. For each panel, pore radius is indicated by color along an axis passing through the center of the pore (y axis) as a function of simulation time (x axis). Pore radii were calculated using the program HOLE 2.0 (31).

