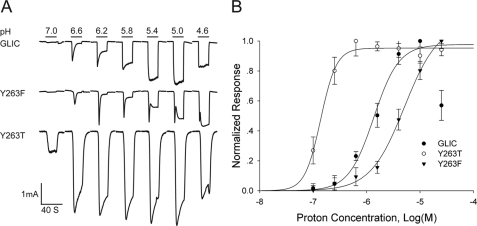
FIGURE 7.
pH activated ionic currents for mutations of Tyr-263. A, ionic currents versus time in response to the indicated step changes in pH for wild type GLIC and the indicated mutants of Tyr-263. B, relationships between ionic current and pH for GLIC and the indicated mutants. Smooth curves are fits of the Hill equation to the data with the following parameters: for wild type GLIC the EC50 = 1.09 × 10⁻⁶ m (pH = 5.96), and the Hill coefficient nH = 2.20 + 0.15 (n = 5); for Y263T the EC50 = 1.38 × 10⁻⁷ m (pH = 6.86) and nH = 2.9 + 0.44 (n = 3); for Y263F the EC50 = 5.088 × 10⁻⁶ m (pH = 5.3) and nH = 1.36 + 0.15 (n = 3).

