FIGURE 3.
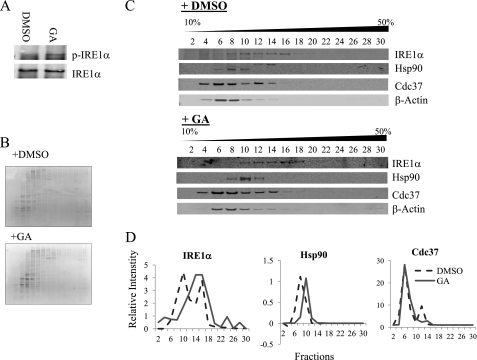
Dynamic interaction between IRE1α and Cdc37. A, INS-1 cells were treated with DMSO or 1 μg/ml GA for 15 min, and cell extracts were fractionated in a 10 to 50% sucrose gradient. B, images of Coomassie-stained gels of protein fractions from DMSO and GA-treated INS-1 cell extracts. C, immunoblot analysis of protein fractions for IRE1α, Hsp90, Cdc37, and β-actin as indicated. D, bands were quantified and plotted to show the difference in migration pattern.

