FIGURE 2.
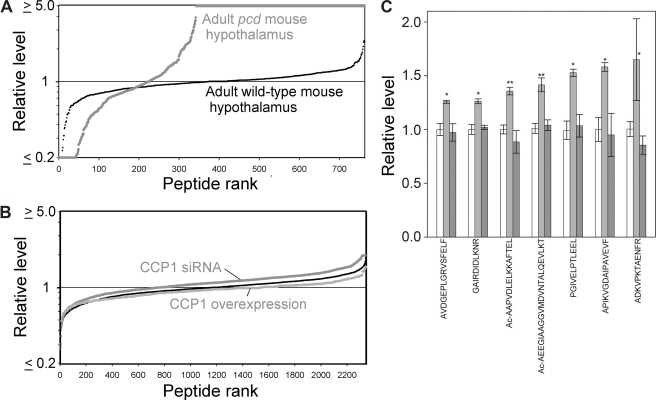
Effect of CCP1 on peptide levels in HEK293T cells and WT and pcd mice. Quantitative peptidomics was used to analyze the levels of peptides derived from cytosolic and mitochondrial proteins. A, relative levels of peptides in the hypothalamus of adult WT and pcd mice. Each dot in the graph represents the ratio of a peptide in one replicate of the indicated group versus the average level in the WT replicates. Small black circles show the WT/WT ratio; larger gray circles represent the pcd/WT ratio. The y axis is logarithmic and is capped at either 5-fold decreases (ratio ≤0.2) or increases (ratio ≥5). The x axis represents the relative rank order of each peptide, compared with all other peptides detected in the study. B, relative levels of peptides in control HEK293T cells, in cells overexpressing CCP1, and in siRNA-treated HEK293T cells. Each dot in the graph represents the relative level of an individual peptide in one replicate of the indicated group versus the average level of that peptide in the control groups for that experiment. The thin black line (i.e. the small black circles) shows the control/control ratio, the lower light gray line shows the ratio for CCP1 overexpression/control; and the upper dark gray line shows the ratio for CCP1 siRNA/control. C, effect of CCP1 knockdown or overexpression on the level of individual peptides. Levels of peptides detected by peptidomics of HEK293T cells after CCP1 knockdown and overexpression were analyzed and compared with controls pooled from both experiments. Graph shows the relative levels of those peptides that showed statistically significant changes after CCP1 knockdown for 3 days compared with controls. VVRHQLLKT is derived from cytochrome c oxidase subunit 7c; AVDEPLGRVSFELF, KHTGPGILSM, and ADKVPKTAENFRAL from peptidylprolyl isomerase A; GAIRDIDLKNR from splicing factor, arginine/serine-rich 1; MTEEAAVAIKAMAK from eukaryotic translation initiation factor 5A; Ac-AAPVDLELKKAFTEL from prefoldin subunit 1; Ac-AEEGIAAGGVMDVNTALQEVLKT from of 40 S ribosomal protein S12; PGIVELPTLEEL from NADH dehydrogenase 1α subcomplex, 8; and APIKVGDAIPAVEVF from peroxiredoxin 5. n = 6 for controls, n = 2 for KD/overexpression. *, p ≤ 0.05; **, p ≤ 0.01 versus pooled controls using two-tailed Student's t test.

