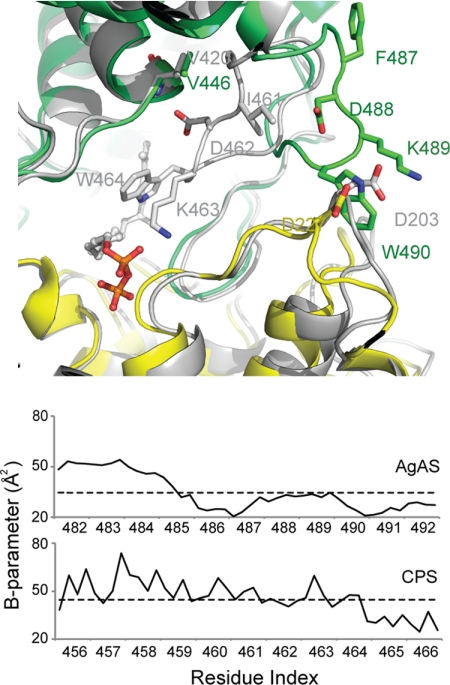
FIGURE 3.
Comparison of AgAS and AtCPS class II active sites. Top panel, the class II active sites define the in conformation of loop 456–466 of AtCPS (gray) and the out conformation of loop 482–492 of AgAS (colored as in Fig. 2). Bottom panel, B-parameters of loop 482–492 in AgAS and the corresponding loop 456–466 in AtCPS are near or below the average value (dotted line) for each structure.

