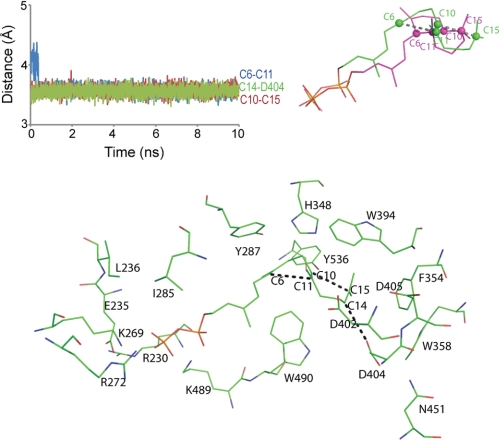
FIGURE 8.
Model of the productive complex for AgAS-GGPP from a restrained molecular dynamics simulation. Plots of distances C6–C11, C10–C15, and C14–Asp404:OD1 are plotted against time (top left panel). The final model from the simulation is aligned with the product of the reaction (top right panel). Atoms C6, C10, C11, and C15 are represented by spheres. Shown is the protein in the vicinity of GGPP in its productive conformation (bottom panel).

