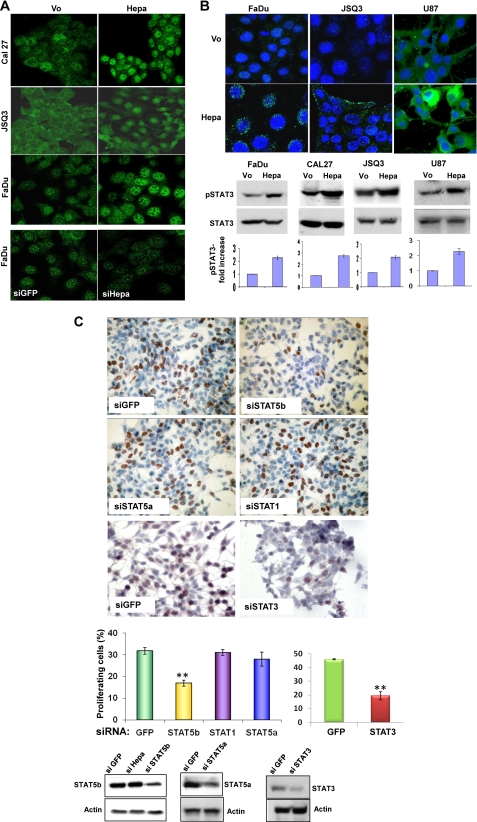
FIGURE 3.
Heparanase modulates STAT5b and STAT3 phosphorylation. A, heparanase overexpression and gene silencing. Cal27 (upper panels), JSQ3 (second panels), and FaDu cells (third panels) were transfected with an empty vector (Vo) or heparanase gene construct (Hepa), and stably transfected cells were subjected to immunofluorescent staining with anti-STAT5b antibody. FaDu cells were transfected similarly with anti-GFP (siGFP) or anti-heparanase (siHepa) siRNA oligonucleotides. Three days thereafter, cells were subjected to immunofluorescent staining with anti-STAT5b antibody (lower panels). Note increased nuclear STAT5b in heparanase-overexpressing cells and decreased nuclear STAT5b following heparanase gene silencing. Original magnification, ×40. B, STAT3 phosphorylation. FaDu (lower left panels), Cal27 (second left panel), JSQ3 (second right panel), and U87 (lower right panels) cells were transfected with empty control (Vo) or heparanase expression vector (Hepa), and lysate samples were subjected to immunoblotting applying anti-pSTAT3 or anti-STAT3 antibodies. STAT3 phosphorylation index calculated by densitometry analysis (Vo cells arbitrary set to a value of 1) of at least five independent experiments is shown in the bottom panels. Control (Vo) and heparanase-transfected (Hepa) FaDu (upper left panel), JSQ3 (middle panels), and U87 (upper right panels) cells were also subjected to immunofluorescent staining applying anti-pSTAT3 antibody (green); nuclei counterstaining (DAPI) is shown in blue. Original magnification, ×63. C, BrdU incorporation. Subconfluent heparanase-transfected LNCaP cells were transfected with control (siGFP), anti-STAT5b, anti-STAT5a, anti-STAT1, or anti-STAT3 siRNA oligonucleotides. After recovery for 2 days in growth medium, cells were kept in serum-free medium for 20 h followed by incubation with BrdU (1:1000) for 2 h. Cells were then fixed and immunostained with anti BrdU monoclonal antibodies. Positively stained, red-brown nuclei were counted versus blue, hematoxylin counterstained nuclei (upper panel). At least 1000 cells were counted for each cell type, and the percentage of positively stained cells is noted in each bar. Decreased STAT3, STAT5b and STAT5a levels following siRNA transfection are shown in the lower panels.

