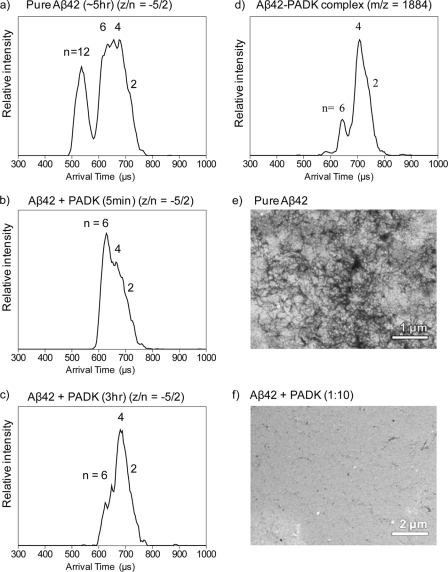
FIGURE 2.
a–c, ATDs of z/n = −5/2 of Aβ42 in a time-course study of recovery of aggregated Aβ42 by PADK. a, Aβ42 without PADK on ice for ∼5 h. b, 5 min after PADK was added to the same aggregated Aβ42 sample. c, 3 h after PADK was added to the aggregated Aβ42 sample. d, ATD of z/n = −5/2 of the Aβ42-PADK complex (2:1) peak at m/z = 1884. EM images of fibrils of Aβ42 samples that were kept in a refrigerator for 2 weeks are shown. e, Aβ42 sample without PADK. The dark regions are Aβ fibrils and plaques. f, 1:10 mixture of Aβ42 and PADK. Essentially no fibrils are observed.

