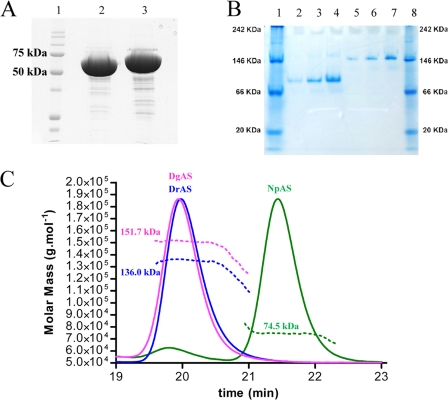
FIGURE 5.
Biochemical analysis of DgAS and NpAS. Panel A, SDS-PAGE of protein markers (lane 1), DgAS (lane 2), and NpAS (lane 3). Panel B, native PAGE of protein markers (lanes 1 and 8), NpAS (lanes 2–4), and DgAS (lanes 5–7); for both enzymes, no effect of dilution is visible (concentration in proteins are 0.5, 1, and 2 g liter−1, respectively). Panel C, SEC-MALLS/RI experiments for NpAS (green line), DgAS (purple line), and DrAS (blue line). Continuous lines represent the light scattering curve, dashed lines define the variation of refractive index. The experimentally measured molecular weight distribution (as horizontal lines) and the average molecular weight are indicated for each elution peaks.

