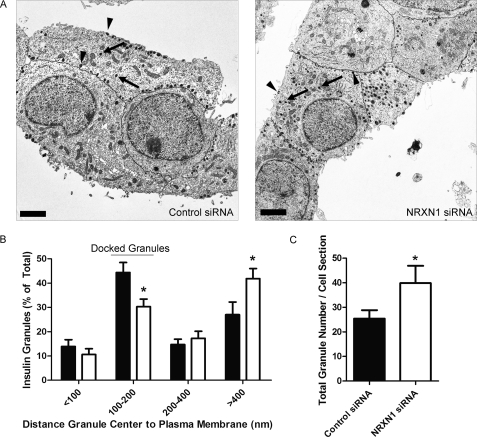
FIGURE 5.
NRXN1 knockdown in INS-1E cells reduces the percentage of insulin granules docked at the plasma membrane. INS-1E cells were treated with NRXN1 or control siRNAs. Cells were fixed, pelleted, and sectioned for EM. A, representative electron micrographs of control siRNA- and NRXN1 siRNA-treated cells are shown. Cell borders are traced in black. Scale bars indicate 2 μm. Arrows point to examples of undocked granules. Arrowheads point to examples of docked granules. B, in cells treated with control siRNA (black bars) and NRXN1 siRNA (white bars), granules were classified into four groups based on the distance from the center of each granule to the plasma membrane. Data are represented as the distribution of granules among the four groups. C, average total granule number per cell cross section after control or NRXN1 siRNA treatment is depicted. All data are represented as mean ± S.E. from 20 cells. Statistical significance was determined using a Student's t test. *, p < 0.05 indicates the comparison of control siRNA and NRXN1 siRNA-transfected cells.

