FIGURE 6.
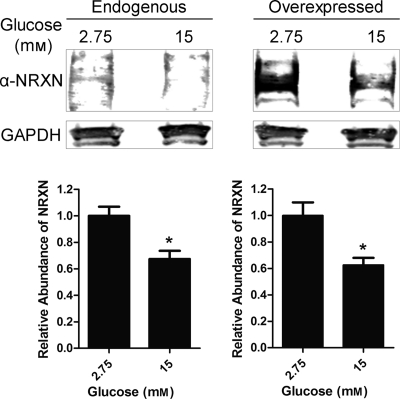
Glucose stimulation causes a decrease in NRXN protein content. INS-1E cells were either untransfected (Endogenous, left panel) or transfected for 48 h with a NRXN1α overexpression construct (Overexpressed, right panel). Cells were treated for 1 h with a Krebs-Ringer solution containing 2.75 mm (low) or 15 mm (high) glucose. Total cell lysates were immunoblotted for NRXN and the loading control GAPDH. Representative Western blot images show lysate pooled from six different untransfected (Endogenous) and NRXN1α-transfected (Overexpressed) samples treated with low or high glucose concentration. For quantitation of relative NRXN abundance, shown in the lower two panels, intensity of bands was normalized to the GAPDH loading-control band. Data in the lower two panels are represented as mean ± S.E. from seven experiments. Statistical significance was determined using a Student's t test. *, p < 0.05 indicates the difference compared with low glucose-treated controls.

