FIGURE 7.
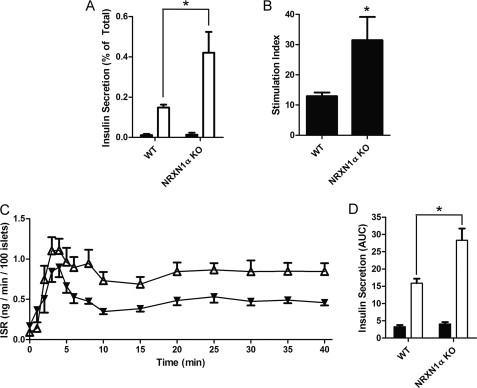
Islets from NRXN1α KO mice have increased glucose-stimulated insulin secretion. Islets were isolated from WT or NRXN1α KO mice and allowed to recover overnight in culture. A, islets were incubated for 1 h in Krebs-Ringer solution containing either 2.75 mm (black bars) or 16.7 mm glucose (white bars). Insulin secreted by WT (left) and KO (right) islets is depicted as percent of total insulin content. B, glucose stimulation index for WT and KO islets was derived from the experiment shown in panel A. The stimulation index is the ratio of insulin secretion (% of total) at 16.7 mm to secretion at 2.75 mm glucose. C, islets were perifused in Krebs-Ringer solution containing 3 mm glucose and then switched at time 0 to 20 mm glucose. The insulin secretion rate (ISR) of WT (black triangles) and NRXN1α KO islets (white triangles) was measured every minute for the first 6 min, every 2 min until minute 10 and then every 5 min until minute 40. D, area under the curve (AUC) was calculated for the first 5 min to determine first-phase insulin secretion (black bars) and then from minute 10 to 40 to determine second-phase insulin secretion (white bars). The ISR at the peak of first-phase secretion (3 to 5 min) was on average 40% greater in KO islets (p = 0.02). Data from static cultures are represented as mean ± S.E. from three samples, and each experiment was repeated three times with similar results. Perifusion data are represented as mean ± S.E. from six islet preparations of each type. Statistical significance was determined using a Student's t test. *, p < 0.05 indicates the comparison of secretion from WT and NRXN1α KO islets.

