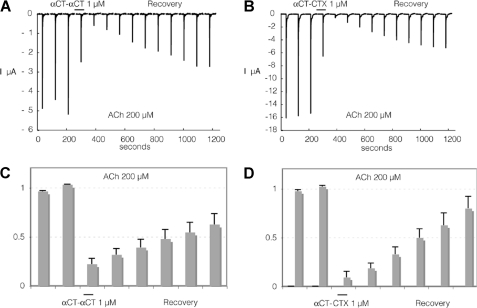
FIGURE 4.
Interaction of αCT-αCT and of heterodimer αCT-CTX with human α7nAChR heterologously expressed in Xenopus oocytes. To evaluate effects of the toxin, cells were challenged at a regular interval (2 min) with brief ACh test pulses (200 μm, 5 s). Following a stabilization period, toxin was applied at 1 μm for at least 1 min. The response to ACh (200 μm) was tested again, and recovery from inhibition was monitored over several minutes. Results obtained with αCT-αCT are illustrated in A and C whereas effects of αCT-CTX are shown in B and D. Average effects of αCT-αCT measured on three cells with 10-min recovery are presented in C. Average effects of αCT-CTX are presented in D on four cells. Bars indicate S.E.

