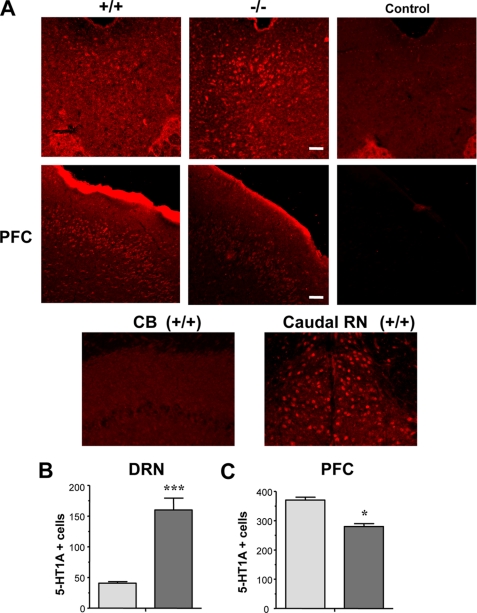
FIGURE 5.
Regional changes in 5-HT1A protein expression in Deaf-1 knock-out mice. A, 5-HT1A receptor immunoreactivity in wild-type (+/+) and Deaf-1 knock-out (−/−) mice in DRN and prefrontal cortex (PFC), cerebellum (CB, negative control), and adjacent caudal raphe nuclei (Caudal RN). Secondary antibody alone was used as a negative control (Control). Representative images are shown at magnification of ×10 (DRN and PFC) and ×20 (CB and Caudal RN). Scale bars, 100 μm. B and C, quantitative analysis of 5-HT1A receptor-positive cells in DRN (B) and prefrontal cortex (C) of wild type (+/+) and Deaf-1 knock-out (−/−) mice. Counts are presented as number of 5-HT1A + cells ± S.E. (error bars), n ≥ 3 mice. *, p < 0.05 by two-tailed unpaired t test; ***, p < 0.01 by two-tailed t test.

