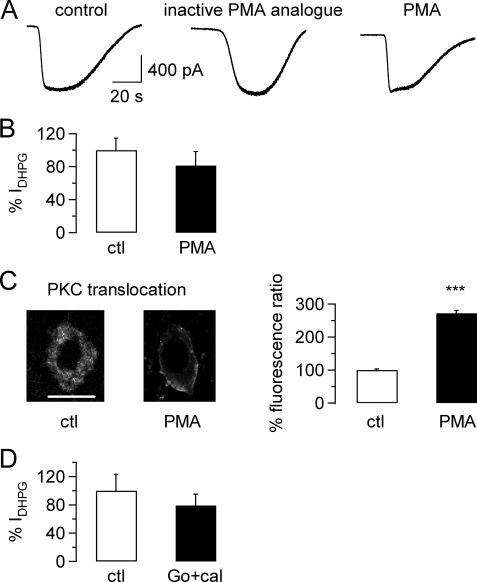
FIGURE 2.
Lack of inhibition on mGluR1-mediated TRPC3 currents in rat Purkinje cells after activation of protein kinase C. A, raw traces show TRPC3 current in response to application of 50 μm DHPG under control conditions (left graph) after preincubation in an inactive PMA-analog (1 μm; preincubation time 13 min; middle graph) and after preincubation in the PKC activator PMA (1 μm; preincubation time 14 min; right graph). B, aggregate data compare the size of the DHPG-mediated TRPC3 current (IDHPG) under control (ctl) conditions (including inactive PMA analog; n = 16; white column) and after exposure to PMA (n = 15; black column). Current amplitude was normalized to average control current amplitude. There was no significant difference between current amplitudes under control and test conditions (p = 0.3622, unpaired Student's t test). Average preincubation time in 1 μm PMA was 15.3 ± 1.3 min (n = 15 cells) and in the inactive PMA analog, 14.1 ± 1.2 min (n = 7 cells). C, right, representative images show distribution of PKC under control conditions and after incubation with PMA (5–10 min) in 2 Purkinje cells; scale bar = 50 μm and applies to both images; left, shown is a significant increase in membrane fluorescence ratio in Purkinje cells exposed to PMA compared with control Purkinje cells, demonstrating movement and, hence, activation of PKC upon exposure to PMA (n = 9 for PMA exposed cells and n = 6 for control cells; p < 0.0001, unpaired Student's t test). D, aggregate data compare the size of the DHPG-mediated TRPC3 current under control conditions and after preincubation with 0.5 μm calphostin (cal) and 1 μm Go6976 (Go), or just 1 μm Go6976 for 45.2 ± 2.9 min (n = 8 for control and 9 for PKC inhibitor-exposed cells; p = 0.4626, unpaired Student's t test). All drugs under investigation were present during the OAG applications to avoid wash-out of the drugs.

