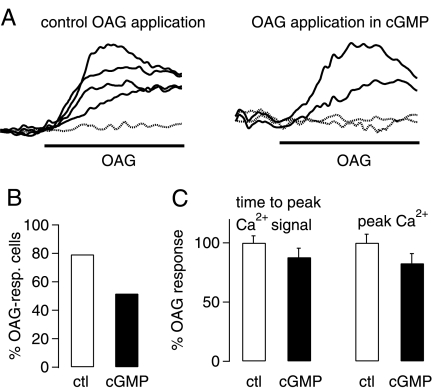
FIGURE 6.
Inhibition of TRPC3 currents by protein kinase G in expression system. A, representative fluorescence Ca2+ imaging traces show increases in intracellular Ca2+ concentration in HEK298 cells stably transfected with human TRPC3 after application of 50 μm OAG under control conditions (left graph) and after preincubation in 1 mm 8-bromo-cGMP (65 min); increases in intracellular Ca2+ concentration are monitored as changes in fluorescence ratio (ΔF), as described under “Experimental Procedures.” Dotted lines show fluorescence signals in cells that were considered to be non-responders. B, aggregate data show that there is a clear decrease in OAG-responsive cells after incubation of TRPC3-transfected cells with 1 mm 8-bromo-cGMP (60–75 min). C, aggregate data show that 8-bromo-cGMP treatment of TRPC3-expressing cells does not significantly interfere with timing of peak Ca2+ signal (measured as time lapsed between application of OAG and peak fluorescence signal; left part of the bar chart; p = 0.8694) or peak Ca2+ signal (measured as peak fluorescence signal compared with base line; right part of the bar chart; p = 0.2838, unpaired Student's t test). White columns, control (ctl; n = 38) conditions; black columns, after exposure to 8-bromo-cGMP (n = 31). All drugs under investigation were present during the OAG applications to avoid wash-out of the drugs.

