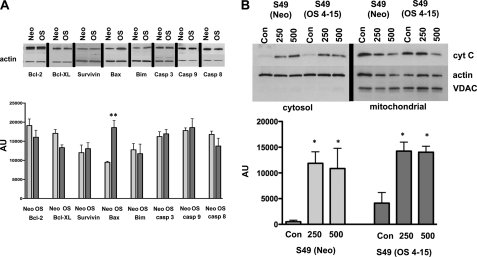
FIGURE 6.
Analysis of the apoptotic pathway in S49 (Neo) and S49 (OS 4–15) cells. A, examination of the expression level various pro- and anti-apoptotic proteins in S49 (Neo) and S49 (OS 4–15) cells showed no significant change, with the exception of Bax that was increased in the apoptotic resistant S49 (OS 4–15) cells. B, examination of the cytosolic fraction of S49 (Neo) and S49 (OS 4–15) cells shows the occurrence of cytochrome c in both the S49 (Neo) and S49 (OS 4–15) samples after osmotic stress. Data represent the mean (± S.E.) of 3 to 4 independent experiments. *, p < 0.05; **, p < 0.01 versus control.

