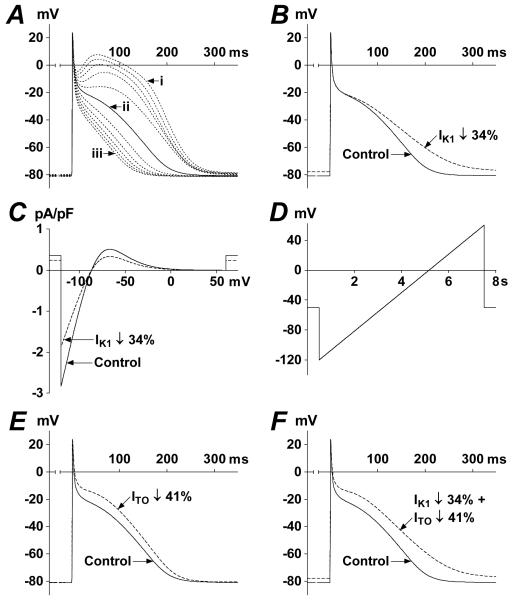
Figure 5.
Mathematical modelling of ion current changes associated with β-blocker therapy. (A) Superimposed simulated APs (last APs of 1 Hz trains of 8 APs) resulting from progressive (in 10% steps) simultaneous ICaL-decrease and IKsus-increase. Trace i=100% ICaL+100% IKsus; ii=50% ICaL+150% IKsus; iii=0% ICaL+200% IKsus. (B) Effect of reducing IK1 on AP shape. Control AP=trace ii of panel A. (C) Effect of reducing IK1 on simulated quasi-steady-state IK1-voltage relationship obtained with the voltage-ramp in D. (E) Effect of independent reduction in ITO on AP shape. (F) Effect of simultaneous reduction in IK1 and ITO on AP shape.

