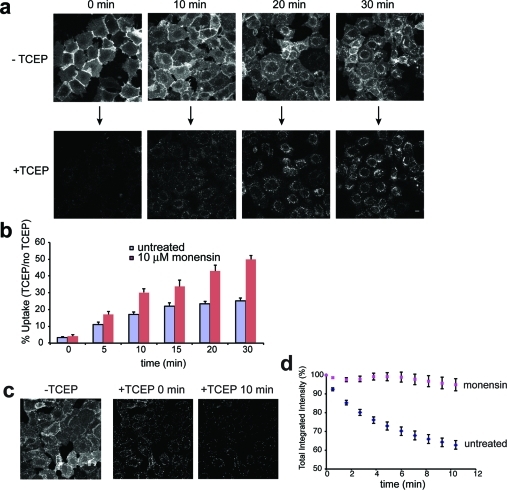
Figure 2.
Endocytosis and recycling of BG-S-S-488 labeled SNAP-β2ADR. (a) Internalization in the presence of isoproterenol for indicated times. Images show the same cells before and 30 s after addition of 10 mM TCEP. Scale bar, 10 μm. (b) Quantitation of uptake based on total fluorescence intensity before and after TCEP. Error bars, SEM (n = 14–16 independent time courses for untreated and n = 5 for monensin treated cells). (c) Representative images showing recycling before and after 10 mM TCEP treatment. Scale bar, 10 μm. (d) Quantitation of recycling based on total fluorescence intensity after continuous exposure to TCEP. Error bars, SEM (n = 16 independent time courses for untreated and n = 7 for monensin treated cells).

