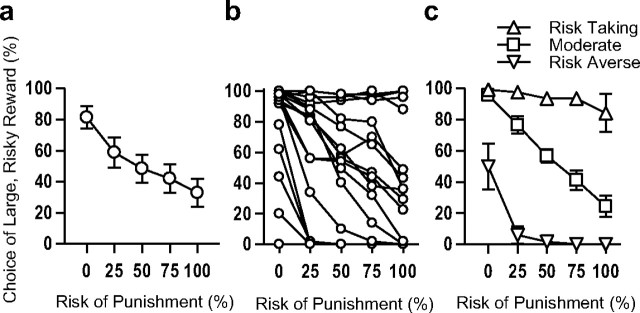
Figure 3.
Performance in the Risky Decision-making Task of rats used in Experiments 2 and 3. a, Risky Decision-making Task group, mean ± SEM. b, Individual variability of risky decision-making. Each line represents data from a single rat. c, Rats were divided into three groups based on risky decision-making performance: risk-taking (n = 5), moderate (n = 7), and risk-averse (n = 6). Data points in each figure represent the means (±SEM) across the final 5 sessions of testing.

