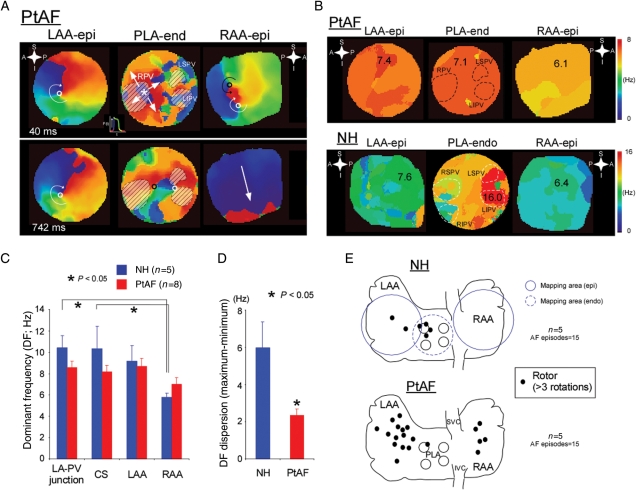
Figure 2.
Reentry dynamics associated with atrial stretch. (A) Representative colour phase maps from three different locations in a PtAF heart. Left, clockwise rotor (curved white arrow) on epicardium of LAA (LAA-epi); middle, breakthrough (BT) (white star and arrows) and complex activation on the endocardium of the PLA (PLA-endo); right, figure-of-eight reentry (black and white circles) and one-way propagating waves (white arrow) on epicardium of the right atrial appendage (RAA-epi). Each colour corresponds to a different phase of the action potential (see insert between top LAA-epi and PLA-end maps). (B) Representative DF maps from same experiment as in (A). Numbers and colours are in Hz. (C) DFs at the LA-PV junction, CS, LAA and RAA during stretch-related AF in NH and PtAF hearts. (D) DF dispersion (DFmax-minimum) in NH and PtAF hearts. (E) Diagrams of the atria showing locations of epicardial rotors (black dots, >3 rotations) in NH (top) and PtAF (bottom) hearts. The areas mapped by the three-camera set-up are represented by the blue circles on the top diagram (plain for epicardial and dashed for endocardial).

