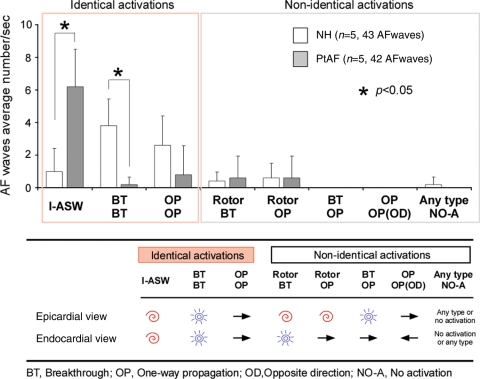
Figure 3.
LAA 3-D activation patterns during AF in normal (NH) and persistent AF (PtAF) hearts. (Upper panel) Most of the patterns were identical on the pericardium and the endocardium (86%). In PtAF hearts, a high percentage of I-ASWs was seen whereas in normal hearts (NH), it exhibited a large portion of patterns that were BTs and one-way propagation waves. (Lower panel) Classification of endocardial and epicardial AF patterns.

