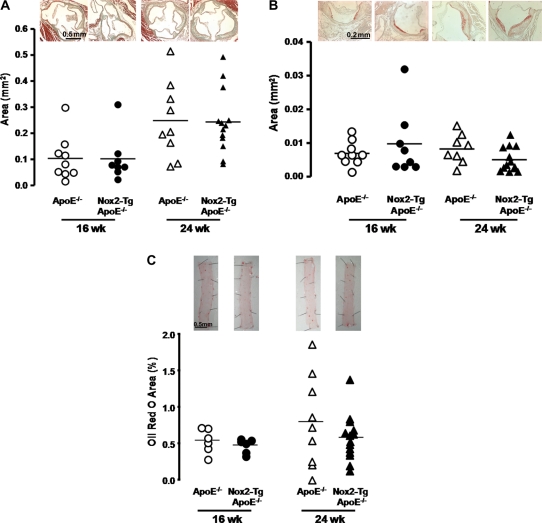
Figure 5.
Quantification of aortic root and aortic atherosclerosis in Nox2-Tg ApoE−/− and ApoE−/− mice at 16 and 24 weeks of age. (A) Aortic root plaque area was quantified using Masson–Goldner staining of aortic root sections. No difference in plaque area was observed between Nox2-Tg ApoE−/− and ApoE−/− mice at 16 or 24 weeks of age (P> 0.05). (B) Aortic root macrophage content was quantified by immunohistochemical staining for Mac-3 (macrophages stained red). No difference in macrophage content was observed between Nox2-Tg ApoE−/− mice and there ApoE−/− littermates (P> 0.05). (C) Aortic atherosclerosis was assessed by en face analysis of Oil red O staining in the aorta of Nox2-Tg ApoE−/− mice and their ApoE−/− littermates. No difference in aortic atherosclerosis was observed between Nox2-Tg ApoE−/− mice and ApoE−/− mice (P> 0.05). A time-dependent increase in aortic root plaque area, macrophage content, and aortic plaque area was observed in both groups (P< 0.05). Each point is representative of one animal.

