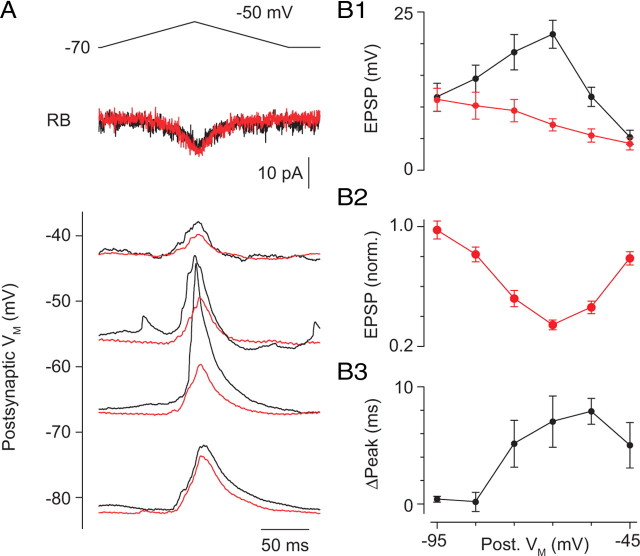
Figure 6.
The contribution of the Na conductance to the EPSP varies with VM. A, EPSPs were evoked by presynaptic depolarization (voltage command and presynaptic Ca currents at top) and recorded at different postsynaptic VM. Averaged traces are illustrated. EPSP amplitudes at different VM are plotted in B1. In the presence of TTX (500 nm), EPSP amplitude varied linearly with VM, as predicted by the change in driving force on the synaptic conductance. Under control conditions, however, the amplitude of the EPSPs was boosted significantly in the range of VM in which GNa is activated. Normalized data are illustrated in B2. p < 0.01 for −45 to −75 mV; p < 0.05 for −85 mV; p > 0.05 for −95 mV. B3, TTX delays the time to peak when VM permits activation of Na channels. p < 0.01 for −55 and −65 mV; p < 0.05 for −45 and −75 mV; p > 0.05 for −85 and −95 mV. Points represent the mean ± SEM of n = 4–13 paired recordings.

