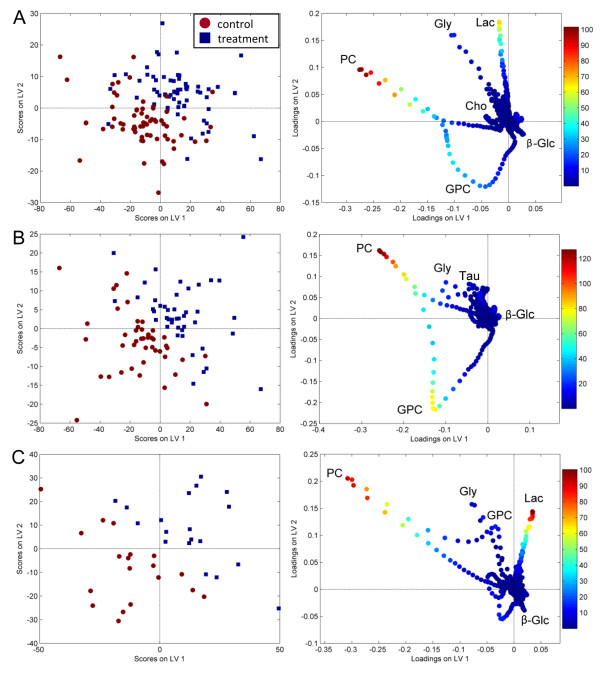
Figure 1.
Scores and loadings from multilevel PLS-DA. The score and loading plots show the two first latent variables separating treatment and control spectra based on (A) the whole data set, (B) 5-year survivors, and (C) non-survivors. The variables in the loadings are colored according to VIP scores, indicating the importance of each variable in the discrimination. The control spectra equal the difference between pre- and post-treatment spectra, while the treatment spectra equal the difference between post- and pre-treatment spectra. The most protruding differences in the loading plots of (B) survivors and (C) non-survivors show a decrease in GPC levels in survivors after treatment, while non-survivors have increased levels of lactate. PC appears to be present in high levels in some samples of both survivors and non-survivors. Lac, lactate; Gly, glycine; β-Glc, β-glucose.

