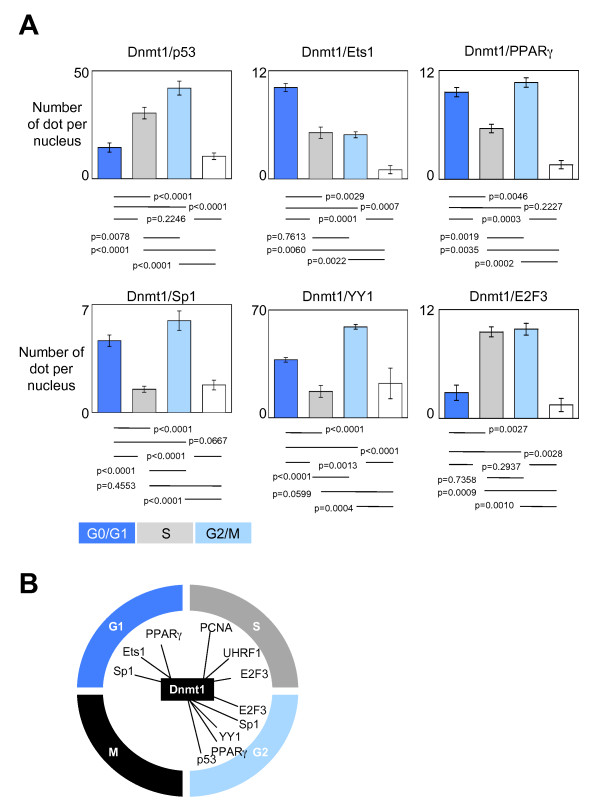
Figure 2.
Dynamic of the formation and of the recruitment on DNA of the Dnmt1/transcription factor-including complexes during the cell cycle. (A) Graph (mean ± SEM) illustrating the number of Dnmt1/transcription factor dots per nucleus in U251 cells during the different phases of the cell cycle. The number of Dnmt1/transcription factor interactions is calculated from the analysis of, at least, 50 nucleus in three independent experimentations. (B) Schematic representation of the dynamic of the Dnmt1-including complexes during the cell cycle.

